Bias in historical records
At the Computational Humanities Research conference 2022 held in Antwerp from December 12 to 14, I co-presented a new paper with Melvin Wevers on missing data in historical archives. The paper was pubslished with CEUR-WS and can be found here: https://ceur-ws.org/Vol-3290/short_paper1793.pdf. Missing data is rather the norm than the exception in historical archives. There are virtually endless reasons why records did not survive the test of time: they might have been lost due to natural causes, such as fires, decisions on the level of archival policy making, but also due to content production biases. When working with incomplete data archives, we run into all kinds of risk, such as overestimating the impact of specific historical events, misrepresenting class, and underestimating casualties. For this reason, we need to critically evaluate whether the data we are left with is representative of the archival collection or historical period from which its stems.
Our paper is concerned with data loss in the archives of the Dutch East India Company, a large trade company in that operated between 1602 and 1796. The company kept detailed records about its employees, but a significant part these records did not survive. More specifically, we do not know how the loss of records is distributed temporally, and we also lack information on the number of unique individuals hired by the VOC. To estimate the loss of records over time and the unique number of individuals, we apply an unseen species model from ecology, which aim to estimate the number of unseen classes given a frequency distribution of observed classes. (I’ve written about unseen species before, see for example Demystifying Chao1 with Good-Turing, Estimating Richness under Sampling without Replacement, and Population Size Estimation as a Regression Problem.)
Archives
The paper makes use of two data sources. The first one, `VOC: CAREERS’ (VOCCAR) contains about 775k digitized contracts that were issued between 1633 and 1795. The contracts specify, among other things, the name, rank, place of birth of the contractee, the date of sailing, and the ship on which they sailed. The original ledgers could contain multiple contracts belonging to the same person. These records have been disambiguated, allowing us to trace the same person in the data. This disambiguation is not complete, however. Approximately 547k records have been succesfully clustered and this set amounts to ~460k unique seafarers.
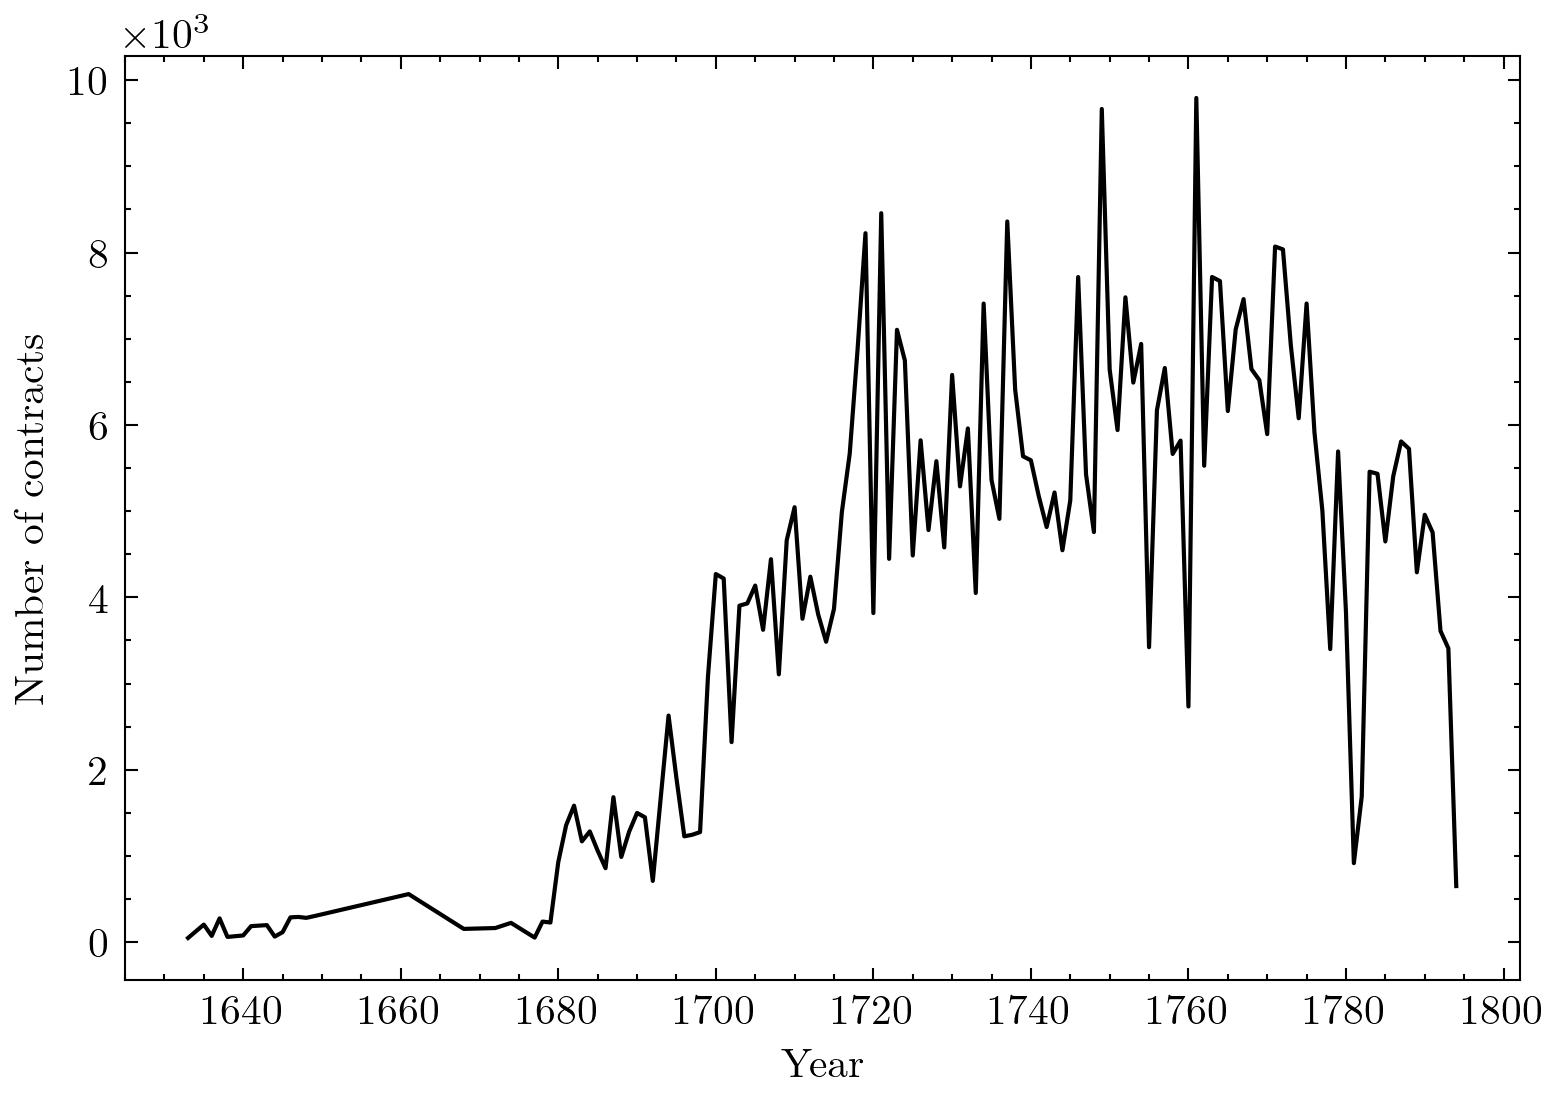
The figure above displays the number of contracts throughout the 17th and 18th century. We observe a sharp increase during the 17th century and also noticeable gaps in the 18th century. The low number of records in the 17th century is likely due to missing data, as well as unresolved records. Based on the observed and disambiguated data alone, we would thus severely underestimate the number of unique employees of the company.
Complemantary to the VOCCAR dataset, we use a dataset that provided an overview of the number of ships that sailed out from the Dutch republic. This data is available from the source `Dutch Asiatic Shipping in the 17th and 18th centuries’ (DAS). DAS describes 4,352 sea voyages between 1633 and 1795. For around 91 percent of these voyages, DAS provides information on the number of people that boarded the vessel. We imputed the missing 9 percent by calculating the mean voyagers per ship for periods of twenty-five years using the data we do have.
Estimating Unseen Individuals
So, we know for a fact that many records were lost. Moreover, not all records have been disambiguated, so we do not know which individuals they refer to. So how then can we find out how many unique individuals were employed by the East India Company? To answer that question, we used an Unseen Species Model. Unseen species models were originally developed to estimate the number of species in a given environment based on incomplete survey data. Recently, this type of model has also been applied in the cultural domain, with for example an application of medieval forgotten books (Kestemont et al. 2022). Here, we want to apply the model to estimate how many unique individuals have been lost due to lost ledgers, or have not yet been disambiguated and are therefore still unseen.
One of the most well-known unseen species models is the Chao1 model, named after its creator Anne Chao (Chao 1984) (for some more background about the model, see Demystifying Chao1 with Good-Turing). Unfortunately, this model cannot be applied to our data because the model assumes samples to be formed with replacement (see Estimating Richness under Sampling without Replacement for more details). When an ecologist does a census in a particular area, she or he may observe the same animal – that is, the same individual – several times. And this repeated observation forms the basis for the calculation of Chao1. Important to the underlying assumption of the model is that as long as the ecologist sits for long enough – and the observed animals live long enough – the researcher can, in principle, make an infinite number of observations. Again, and again, certain animals are spotted. In other words, the Chao1 estimator assumes an “infinite population”.
Our data is different in an important way. In our case too, we have repeated observations of individuals, but, and this is crucial, that repetition is not potentially infinite. As such, we are dealing with a finite population, of which the log files of the East India Company hold a sample. That difference between finite and infinite populations is key. Just like knowing whether your data is formed with or without replacement. Because if we apply Chao1 to data samples without replacement, it can greatly overestimate the true number of unseen things, and the estimates thus become highly unreliable. I will come back to this when discussing the results.
A better fit to our data is an extension of Chao1 developed by Chao and Lin (2012) specifically for data sampled without replacement. As in the original Chao1 model, we need information about the number of items that occur once, and the number of items that occur twice. The difference between the extension and Chao1 is that the extension requires information about the size of the total population. Because several log books have disappeared, we do not have that information, but we can make a reasonable estimate. For the exact details about how we do that, please have a look at the paper. But simply put, we estimate the total population \(N\) by taking the mean number of sailors from all known ships and multiplying that by the number of voyages of the East India Company. We know the total number of voyages, just not how many people were involved with each of them. This number may not be precisely accurate, but it gives us a relatively good and robust estimate of the total population.
Results
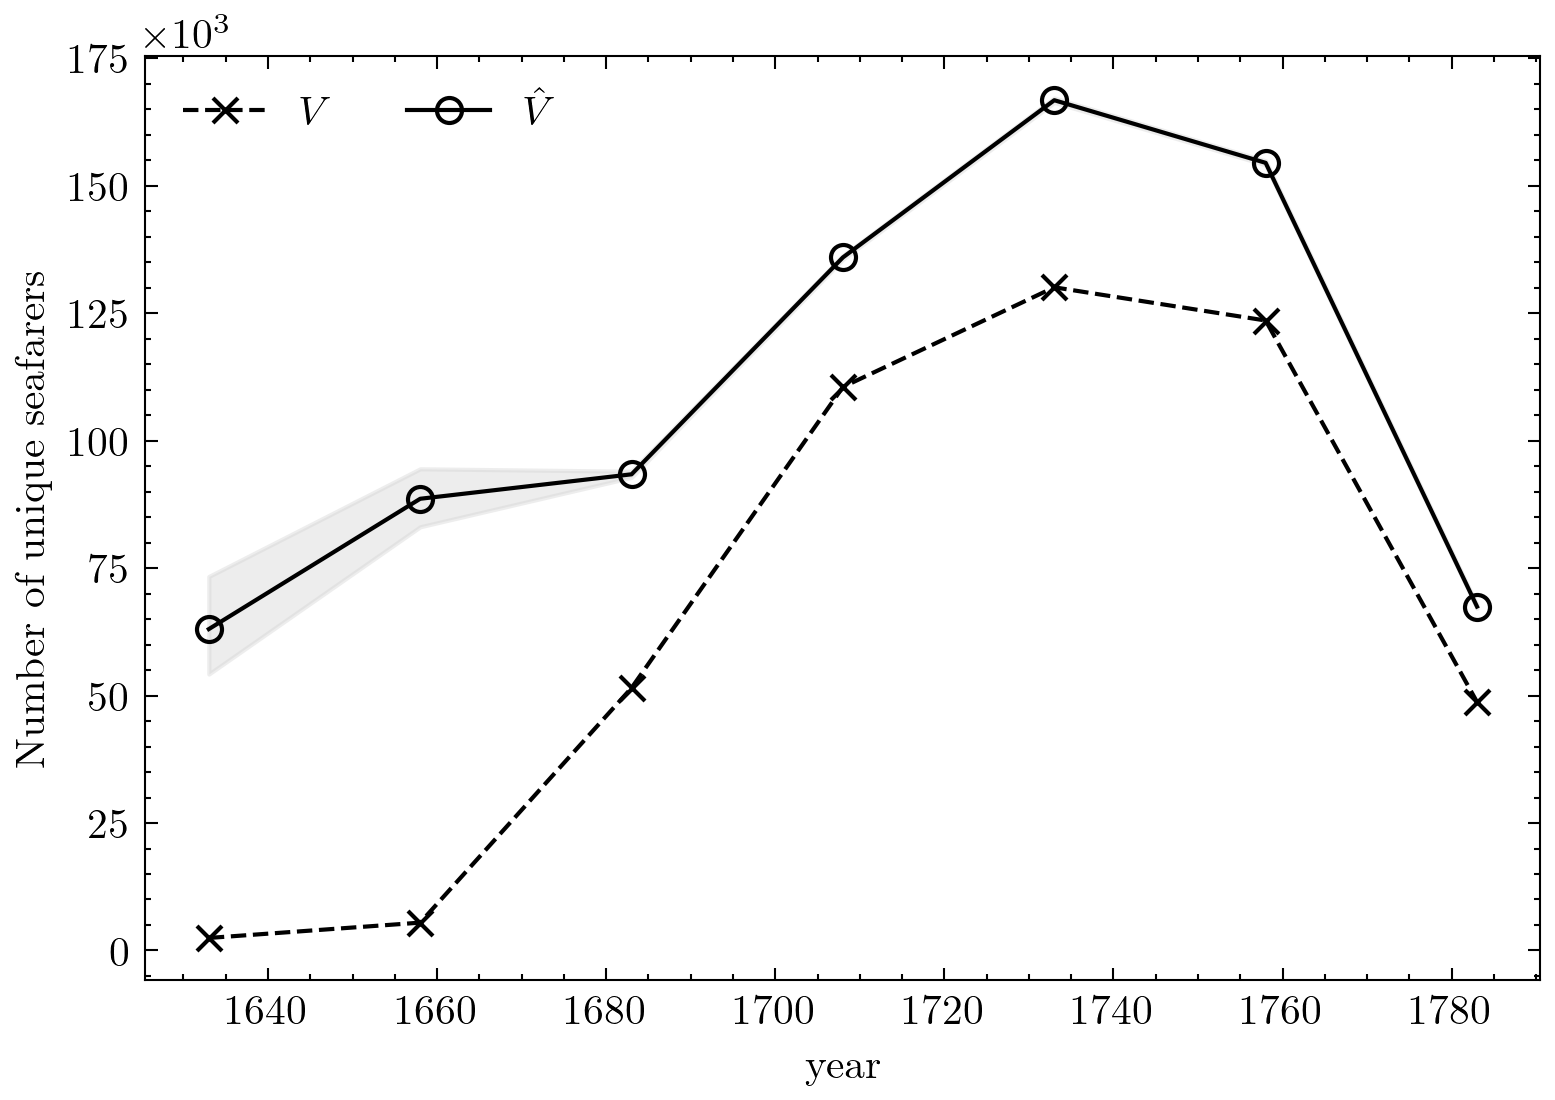
The application of this model yielded the following three main results and insights. First, the model estimates that at least 36% of the individuals employed by the East India Company are unseen. Or, conversely, the survival rate is about 64%. In addition, we see large differences in the survival rates over time. The plot here shows that far fewer individuals are known from the early years, and thus the survival rate is much lower. The difference in this period between observed and estimated ranges between 45% in 1683-1708 to as high as 96% between 1633-1658.
Finally, the model estimates that about 715k individuals were employed by the company. This number is much more conservative than the estimate of the Chao1 model, which estimates that there must have been more than 2 million employees. This number is obviously wrong, because that would mean that the number of individuals is many times larger than the total number of observations. I tried to capture this in the animation below. Here the ship has a maximum capacity of \(N\) employees. We first fill the ship with the 460k observed seafarers in green. We add to that the additional 255k unseen sailors, making a total of 715k sailors. An estimation with Chao1, however, would overflow the ship immediately with its 2.3 million individuals.
Future work
Our results provide a concrete answer to the question of how many people were employed by the Dutch East India Company. In addition, the study highlights the importance of having knowledge about the sampling process underlying the data when applying these unseen species models. The lesson here is that a wrong assumption can lead to completely implausible or even impossible(!) results.
For our data, we are fortunate to be able to provide a relatively reliable estimate of \(N\), but that is by no means the case for all historical databases. Therefore, for future work, we want to investigate the impact of uncertainty about \(N\) on the quality of the estimates. In addition, we want to investigate how adding information about the records can further improve the quality of the estimates. Chao1 assumes all unseen data to be equally unlikely. Yet, this is obviously not necessarily true. By including information that explains differences in occurrence probabilities, we hope to make our estimates more precise (see Population Size Estimation as a Regression Problem for more information).